|
2 f X# l( P' H8 i7 ^
原标题:基于 Grafana LGTM 可观测平台的构建 , M- A. g/ {+ }' F+ i$ n" G$ L2 d$ F
1 R5 F( X0 q, n" b/ t9 ^  可观测性目前属于云原生一个比较火的话题,它涉及的内容较多,不仅涉及多种遥测数据(信号),例如日志(log)、指标(metric)、分布式追踪(trace)、连续分析(continuous profiling)、 事件(event);还涉及遥测数据各生命周期管理,比如暴露、采集、存储、计算查询、统一看板。 可观测性目前属于云原生一个比较火的话题,它涉及的内容较多,不仅涉及多种遥测数据(信号),例如日志(log)、指标(metric)、分布式追踪(trace)、连续分析(continuous profiling)、 事件(event);还涉及遥测数据各生命周期管理,比如暴露、采集、存储、计算查询、统一看板。
6 Q; ?( P1 Q2 D& A 目前社区相关开源产品较多,各有各的优势,今天我们就来看看如何使用 Grafana LGTM 技术栈(Grafana、Loki、Tempo、Mimir)快速构建一个自己的可观测性平台。 $ t, k) P" D$ I2 ]( m
通过本文你将了解:
0 H4 r2 R# I* c$ l; E 如何在 Go 程序中导出 metric、trace、log、以及它们之间的关联 TraceID - q/ Z6 A& N( |0 K; K8 U
如何使用 OTel Collector 进行 metric、trace 收集 / r J/ z% O; u
如何使用 OTel Collector Contrib 进行日志收集
, Q; x7 b. g. E$ d7 c 如何部署 Grafana Mimir、Loki、Tempo 进行 metric、trace、log 数据存储
* [( [1 L6 ]+ B! f! J" g0 S( x 如何使用 Grafana 制作统一可观测性大盘
: I6 E6 Z: s7 W$ b6 r' _ 为了本次的教学内容,我们提前编写了一个 Go Web 程序,它提供 /v1/books 和 /v1/books/1 两个 HTTP 接口。 4 g6 p$ n, M \6 R
当请求接口时,会先访问 Redis 缓存,如果未命中将继续访问 MySQL;整个请求会详细记录相关日志、整个链路各阶段调用情况以及整体请求延迟,当请求延迟 >200ms 时,会通过 Prometheus examplar 记录本次请求的 TraceID,用于该请求的日志、调用链关联。 8 r0 j4 F$ O* I% ]1 b( b [
下载并体验样例 " d8 s3 g% g$ S0 q
我们已经提前将样例程序上传到 github,所以您可以使用 git 进行下载:
5 I# f9 R+ J4 F8 r. R# Z* u U git clone https://github.com/grafanafans/prometheus-exemplar.git
# k' p: I$ [4 i: b( n" W cd prometheus-exemplar
1 f( v8 x+ {% I 使用 docker-compose 启动样例程序:
+ K; y6 M; B; G2 p docker-compose up -d
) S# X, G$ l+ I V( @9 H 这个命令会启动以下程序: l3 v, e; d y, ]: e+ r3 s
使用单节点模式分别启动一个 Mimir、Loki、Tempo ; |% f% m/ }8 m+ x u3 i9 V
启动一个 Nginx 作为统一可观测平台查询入口,后端对接 Mimir、Loki、Tempo
' S* K( Y+ P. o, _ c, B$ m 启动 demo app, 并启动其依赖的 MySQL 和 Redis, demo app 可以使用 http://localhost:8080 访问
( ?4 d5 `& n' P 启动 Grafana 并导入预设的数据源和 demo app 统一看板,可以使用 http://localhost:3000 访问 1 Z; A7 t$ i J
整个部署架构如下:
& c% H( J1 h9 [% ^. A2 Z 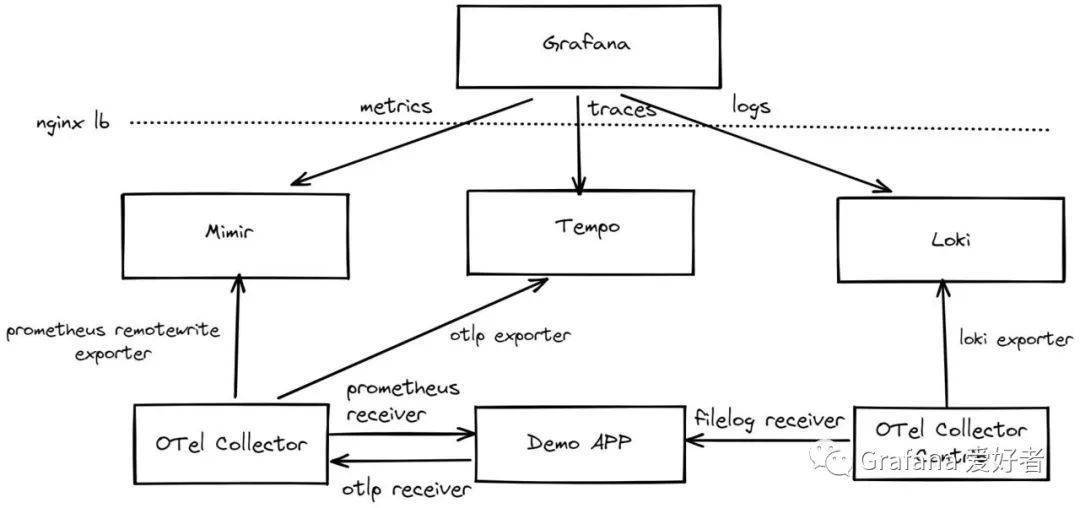
8 h; a0 q) Z7 I' H 当程序部署完成后,我们可以使用 wrk 进行 demo app 接口批量请求:
; w/ O) p H& I5 \: l `6 A% B3 [) |2 Y wrk http://localhost:8080/v1/books
+ k8 l p# ~$ r% r: }4 ] wrk http://localhost:8080/v1/books/1
1 p& n0 d3 @1 l: [, S1 P, Q% O 最后通过 http://localhost:3000 页面访问对应的看板:
, t, F. G( [& y 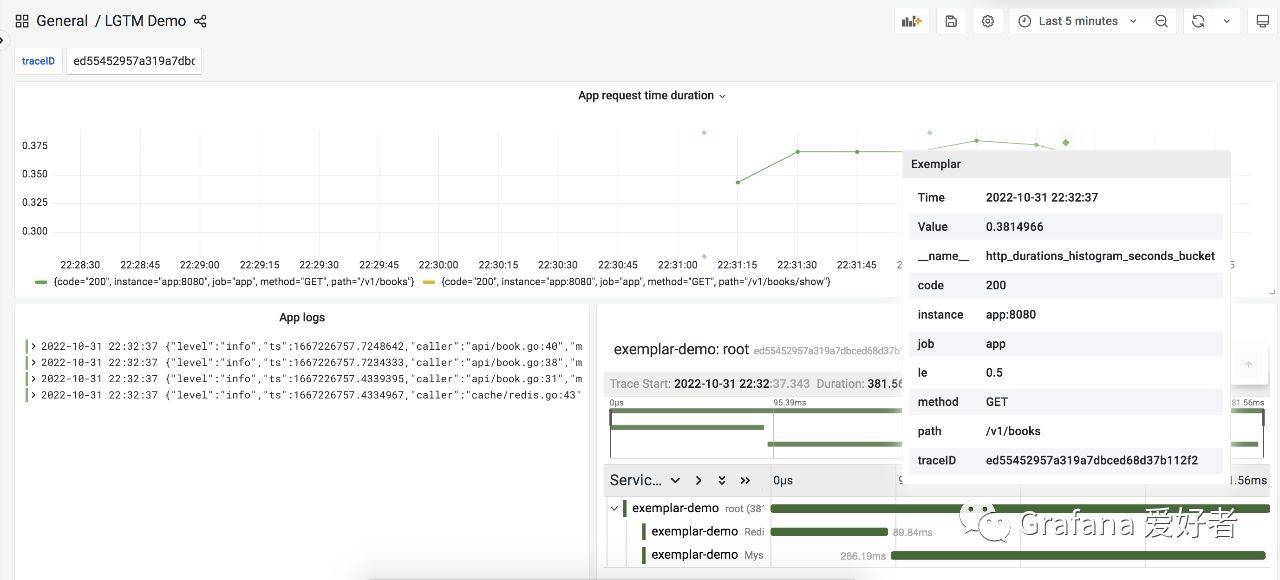
( g8 M2 N* e7 W
细节说明 - ~% R d3 @- Q
使用 Promethues Go SDK 导出 metrics
4 s3 i: |% | Z0 c1 D7 X 在 demo app 中,我们使用 Prometheus Go SDK 作为 metrics 导出,这里没有使用 OpenTelmetry SDK 主要因为当前版本(v0.33.0)还不支持 exemplar, 代码逻辑大致为: 8 N. `' s2 \& |. m7 x- @3 \5 p
func Metrics(metricPath string, urlMapping func(string) string) gin.HandlerFunc <{p> httpDurationsHistogram := prometheus.NewHistogramVec(prometheus.HistogramOpts<{p> Name: "http_durations_histogram_seconds",
" C7 k7 f& R/ N/ O& M2 B Help: "Http latency distributions.", ! Z/ @7 h0 G/ L# Y% r9 W
Buckets: []float64{0.05, 0.1, 0.25, 0.5, 1, 2},
( y: M7 M! ^ {0 p- t$ f3 L2 a }, []string{"method", "path", "code"})
8 k& Q$ @# X. n2 P% Z7 |1 n9 N prometheus.MustRegister(httpDurationsHistogram) + C# t7 j0 O. j! V* G& w O: K* P
return func(c *gin.Context) <{p> .....
6 c& n' q* P# K" c, z' r" C observer := httpDurationsHistogram.WithLabelValues(method, url, status)
4 f# M& C) E" }7 }1 P( o$ D) g observer.Observe(elapsed)
9 \& i$ |; P, ]+ O7 ]$ d- @ if elapsed > 0.2 <{p> observer.(prometheus.ExemplarObserver).ObserveWithExemplar(elapsed, prometheus.Labels<{p> "traceID": c.GetHeader(api.XRequestID),
' l6 \4 x) `, f* Q })
/ H6 _6 g: c( k4 C0 U9 C }
& T$ T9 F! @0 Q% w } / c- r: Q `4 v# _/ W3 N
} , z. q/ g- A, w3 W
使用 OTLP HTTP 导出 traces - A' h+ A; Q4 D4 ?# g
使用 OTel SDK 进行 trace 埋点: 9 y8 b9 z: Z# j) A
func (*MysqlBookService) Show(id string, ctx context.Context) (item *Book, err error) <{p> _, span := otel.Tracer().Start(ctx, "MysqlBookService.Show")
8 m; v, [; S: R# V span.SetAttributes(attribute.String("id", id))
# v6 I' j7 I$ I defer span.End() % o' M. B* e5 m( e( ?
// mysql qury random time duration
7 f4 h7 Z# t* K- @0 ?6 Q8 n( \' R8 e time.Sleep(time.Duration(rand.Intn(250)) * time.Millisecond)
4 h9 D: N( P# x: l err = db.Where(Book{Id: id}).Find(&item).Error 9 B. |+ d- Y* |/ | |# o; W
return ; }7 ]. M! f5 a) G
}
9 Y7 O) s" n( E. o G" t! M 使用 OLTP HTTP 进行导出: 8 q! t R7 y7 q7 w6 c* @: d! m) ^
func SetTracerProvider(name, environment, endpoint string) error <{p> serviceName = name
. g% c3 I) a: H. {# e5 K2 ^ client := otlptracehttp.NewClient(
3 ~, s0 A! v! _4 }3 E. l2 ?0 k otlptracehttp.WithEndpoint(endpoint),
0 L5 m* c- x' s' L otlptracehttp.WithInsecure(),
6 _6 D2 i& [! {; W2 c m" v% H )
5 L! D2 U9 }7 r& G n! z2 Q exp, err := otlptrace.New(context.Background(), client)
7 h4 x& C( P( [. a7 P4 ]$ B `+ ` if err != nil <{p> return err , n1 k; h/ o! L% S- l& a
}
; w6 e0 J& ^( N9 N tp := tracesdk.NewTracerProvider( 2 f% M8 w9 g" K+ G9 M1 M
tracesdk.WithBatcher(exp), % M. H* {$ J0 E! A6 Z9 E ?+ N
tracesdk.WithResource(resource.NewWithAttributes(
+ M( H4 }% ]3 P6 S- t8 [6 ] semconv.SchemaURL,
4 s) p3 G6 s y3 y semconv.ServiceNameKey.String(serviceName),
7 l6 f- J I1 Y attribute.String("environment", environment), ) I, ~) J, G/ F0 y
)),
( t+ ^9 |3 N' A- M ) / g# O9 U$ E2 P3 r( G4 j
otel.SetTracerProvider(tp)
R) a! v- D) W return nil + o9 x1 o- S. g9 Q5 Q
}
$ T2 s+ Y8 {0 v 结构化日志 % o. _9 _- ~7 A" q4 ^. Z9 [
这里我们使用 go.uber.org/zap 包进行结构化日志输出,并输出到 /var/log/app.log 文件,每个请求开始时,注入 traceID: , x0 v& ~4 ^8 [
cfg := zap.NewProductionConfig() , v2 T. y/ Z8 X2 a0 X5 F
cfg.OutputPaths = []string{"stderr", "/var/log/app.log"}
. J, K- Z4 f. ]% {7 _% ? logger, _ := cfg.Build()
5 k5 a$ v2 e- Z0 O! Q logger.With(zap.String("traceID", ctx.GetHeader(XRequestID)))
9 y- I+ h' H) |; h+ u 使用 OTel Collector 进行 metric、trace 收集
. H5 ^* {7 s. N* A 因为 demo app 的 metrics 使用 Prometheus SDK 导出,所以 OTel Collector 需要使用 Prometheus recevier 进行抓取,然后我们再通过 Prometheus remotewrite 将数据 push 到 Mimir。
) c1 w! ~: |" s$ e 针对 traces,demo app 使用 OTLP HTTP 进行了导出,所有 Collector 需要用 OTP HTTP recevier 进行接收,最后再使用 OTLP gRPC 将数据 push 到 Tempo,对应配置如下: $ w* t) x. e" ]1 L2 F O' H
receivers: * `/ B7 d! p, e
otlp: * f- Q9 g+ P( [, E U; a
protocols: 7 b. M' K" A( s k
grpc: 6 y' l/ o( U& u$ R
http:
! N' p' |' R S0 S prometheus: 2 N; |+ E" k' L% _- M
config: 8 W. d- g2 R4 P% ]% h, E
scrape_configs: ! B7 M/ W) l3 h9 d! R# w, l! M
- job_name: app - ~0 N' g g8 k
scrape_interval: 10s ) e$ m& @) j G' f r% S- ~
static_configs:
0 f9 O% b; x! L8 a+ s' S - targets: [app:8080]
! M9 {- S. k9 p9 @2 _8 J, d; V' B exporters:
2 G% b8 l3 ~& j$ B. j S otlp: 7 I* G0 R$ C, k* |, b
endpoint: tempo:4317
: V" o! k+ x3 v4 g# ]) |' _ tls: O" _' U/ ?0 o2 A' o
insecure: true 5 E; M- i- {+ q) v, A
prometheusremotewrite:
5 z# u& |$ S2 [) ]+ v endpoint: http://mimir:8080/api/v1/push
- q. C- d# R' x. D( | tls:
6 U% |4 f% @! D# ]# f$ F0 _ insecure: true O& z& L! S$ F
headers: & ^* M. x/ [9 S/ t' `
X-Scope-OrgID: demo
0 j/ b* C. H1 R. a+ u; D: F3 a- t: b processors:
% q1 J$ b8 g, j# i batch: : a: A: }& E: G
service:
! U6 z2 Y" ^+ Z9 b pipelines: : a6 H3 y+ r$ X# `
traces: N& y/ K1 _% }9 e/ I
receivers: [otlp]
: a% U; J& F7 K4 A1 d processors: [batch]
2 T# n& t) F, W% f0 z; F7 L: y" r exporters: [otlp]
5 e* i% u5 p: g metrics: " J: D) F+ H' b+ M. ?* S/ }
receivers: [prometheus]
6 a3 `6 U' T: W' |- Y3 X9 v processors: [batch]
7 ~( n4 {' `! ?% w1 J/ Z exporters: [prometheusremotewrite]
' i6 h, ~' a' A; M 使用 OTel Collector Contrib 进行 log 收集
- x# F' v9 y4 f 因为我们结构化日志输出到了/var/log/app.log 文件,所以这里使用 filelog receiver 进行最新日志读取,最后再经过loki exporter 进行导出,配置如下:
9 b2 y+ V$ a7 f+ | receivers: 4 E0 r$ a4 {: `1 A! {, i
filelog:
) O- ?) |1 R: ~: M/ B8 c include: [/var/log/app.log] 6 X7 O8 r% Q7 y) ^' e5 h' }
exporters: ( R1 a- `5 l- ~+ y$ e- w7 ?
loki: 3 `8 }) V2 a) |/ d
endpoint: http://loki:3100/loki/api/v1/push , Q( Q% ~; _+ P* y
tenant_id: demo
" w6 V, [6 R) K( ^. f5 B labels:
7 F3 v/ g9 ]' S: M5 \# M attributes:
! N/ D3 g6 d8 p% J" @9 M log.file.name: "filename" 6 z5 J$ T" r/ ? S
processors: 8 e4 d3 E. a* `
batch:
* j9 D: E) e7 K' K# Y, z _+ ? service: l5 C$ U4 s/ h) L
pipelines:
( e4 F0 f( C- q+ X2 f- `! v logs:
0 w: z) ]8 D9 ^+ B receivers: [filelog]
3 x; ^1 @5 {, b* V) n! @ processors: [batch]
8 ~+ U# u, i' s& V5 z: o exporters: [loki] 9 z( t4 M; f. V1 v
以上就是有关 demo app 可观测性与 Grafana LGTM 技术栈集成的核心代码与配置,全部配置请参考 https://github.com/grafanafans/prometheus-exemplar 。
% e' l A+ r0 j; k( M {0 a ?4 }' \ 总结
* H8 b1 E) ^7 R8 |+ w: I 本文我们通过一个简单的 Go 程序,导出了可观测性相关的遥测数据,其中包括 metrics、traces、logs, 然后统一由 OTel Collector 进行抓取,分别将三种遥测数据推送到 Grafana 的 Mimir、 Tempo、Loki 进行存储,最后再通过 Grafana 统一看板并进行 metrics、traces、logs 关联查询。
$ R# F$ q; C- c+ t" U. D* I 这里关联的逻辑为使用 Prometheus 的 exemplar 记录采样对应的 traceID,然后通过该 traceID 进行相关日志和 trace 查询。返回搜狐,查看更多 1 |+ e& k2 c& U
2 g0 }1 t# R3 d% O* ]/ e, F 责任编辑:
2 U. j c9 e7 ~3 Y
: L- {* [( W7 o0 h3 ?2 |3 K! l, W6 I. ^) D: `3 m) T- b" C
( K( I+ k7 l5 r$ ^. c* V% D' z5 ?8 W
| 

 可观测性目前属于云原生一个比较火的话题,它涉及的内容较多,不仅涉及多种遥测数据(信号),例如日志(log)、指标(metric)、分布式追踪(trace)、连续分析(continuous profiling)、 事件(event);还涉及遥测数据各生命周期管理,比如暴露、采集、存储、计算查询、统一看板。

