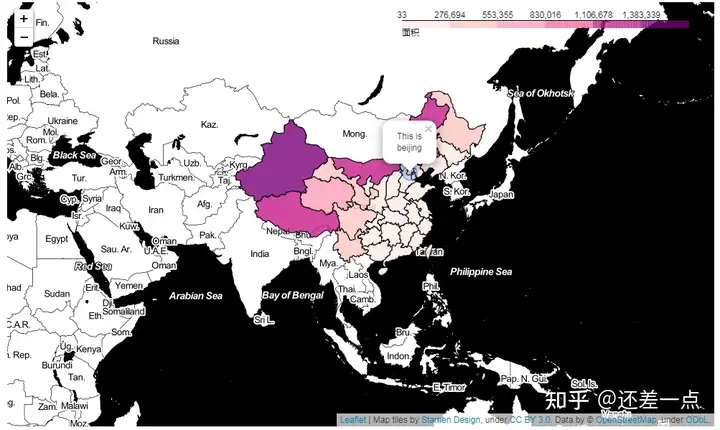
: ^# d P- f: s. W% g& L/ _9 s' N# U Choropleth 等值线图* w( a' V' e# t5 W6 ~4 e# _0 {, ?, {
import pandas as pd #读取数据* w0 z3 t, y4 ]' S
from folium import Map,Choropleth,CircleMarker #用到的包
) [; T o8 D* v! q3 S
( K; G& ]+ L! J* x #包含省的中国地图json
7 m9 G- g2 e8 A0 t china_geo = fhttps://geo.datav.aliyun.com/areas_v2/bound/100000_full.json
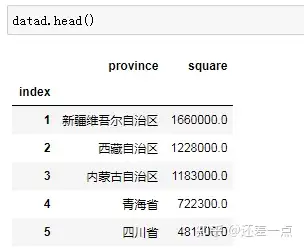
7 Y1 D0 B- y" J7 A #读取用到的面积数据
" i3 ?8 g w4 g H/ ~/ N datad = pd.read_csv(Desktop/square.csv,index_col=index)% X3 z* r5 z( j: v
& m$ s9 Z( Q- j( q2 P4 x
. S5 z, _" `( D+ Q" A m=Map(tiles=Stamen Toner) #地图风格
6 {- [# O7 |: o5 K1 K0 M$ X* R9 P, m7 L; @
Choropleth(china_geo, #选择json* M/ T( R }8 ~: F( I
data = datad, #数据) u% H7 ]" m0 P" X7 j
columns = [province,square], #列,第一个为key,第二个为value' L M% I+ r; b9 q
key_on = feature.properties.name,#匹配到json
* [5 K2 e \. A( K. W fill_color = RdPu, #颜色
4 j; r3 `' Q" t$ I fill_opacity = 0.8, #填充透明度8 x; E( N5 p9 j2 {5 r) o5 G
line_opactity = 1, #线透明度
1 O( F f7 P# C; i line_weight = 1, #线宽* g, R2 ?; F; e
legend_name = 面积 #图例
/ Q4 o+ t. b. \2 Z. k+ m q) T/ z/ z* K7 D- J H
).add_to(m)- U# g" B9 j+ l9 Z* ]) z$ Y
CircleMarker(location = [39.907518, 116.397514], #坐标点
; p9 d( @& m& u2 Q radius = 10, #半径
+ L3 J$ W5 V, b3 W fill = True, #填充; x0 j, k' j$ \+ _% p+ S
popup = This is beijing, #弹窗) Y0 g1 r% s4 Y9 i, e
weight = 1 #circlemarker线宽
2 b) U7 E/ g5 F f9 a) z/ `; f ).add_to(m)
$ @7 f/ S( J9 y7 S m.fit_bounds(m.get_bounds())5 [' h R" e1 \& Q8 F& y4 m( @8 }
m
: h9 }+ U1 i$ S" R 7 n( Y$ {0 L5 I# x ]
$ y. q, T. N6 [( v3 g
数据地址: square.rar - 蓝奏云 7 _- V( D7 Q4 {, f! m8 L3 a& ~
两个重要的网站 4 F9 `0 b/ ?- Y
手动绘制geojson 0 z9 `6 L# L/ `9 v' I9 m
! G0 T0 Q' p& f: _ u1 U$ U7 u 目前更新的geojson . Y( @5 Y k3 V4 U: f
$ P* n. \( [, T geojson格式
) i8 m3 I1 [" j& j2 t* I {1 T% ]' v9 }9 l( @/ H+ f* o
"type": "FeatureCollection",
! \5 B l& e' @" M3 Y3 ~ "features": [
( q7 V8 O7 [/ t2 a: Z2 r {
7 i. |5 V( X1 B( C' W "properties": {"name": "Alabama"},' p6 T% `. d4 ?6 Q) T$ d; H
"id": "AL",6 e) S: w$ `1 L
"type": "Feature",, ]' f* P; A" r
"geometry": {
. ]2 w5 C+ D/ U. _, B! H "type": "Polygon",& M. ]9 \8 a4 Y1 k
"coordinates": [[[-87.359296, 35.00118], ...]]
5 Q# \9 g! z+ P4 k, f }
7 A/ P' ]3 H. [ },* M; @1 A/ \3 V: F
{
2 L! z+ Q9 A0 }. c' a u# U: J "properties": {"name": "Alaska"}," t5 a. v C" J, w0 t5 r, \2 X
"id": "AK",% E( ]! ~6 X2 l
"type": "Feature",
: [) F6 h$ S% _' H2 T3 s "geometry": {; }* B, u" d! k
"type": "MultiPolygon",
i7 c4 L; Y$ E$ P/ e' T. j. _ "coordinates": [[[[-131.602021, 55.117982], ... ]]]
5 ^8 W! I( |7 o }
$ c) M) l, t; o2 D6 d; S },
& j) P4 L9 |6 `0 Y$ @' | ...' S0 E( |$ R: y9 f: k" t+ J
]7 ?% p1 x, n. N5 [
}
0 X# ?! q! z# g/ Q
! S7 m& Y$ \4 `* y) {3 j [0 N 读取本地的json文件 % b3 j E% f* X7 s" v! P. M6 z/ v
f = open(zhengzhou.json)8 _$ k% z+ {5 C0 R. }: L+ Z2 g
t = json.load(f); v1 t6 Z; O. U. ~3 H+ A" Z6 l+ z0 i( |
f8 {$ A% x( k% w9 x! t
读取网络json ! N& g1 @( z! Y- b G
url = (8 ^. p6 {# J+ C- k* B3 ]
"https://raw.githubusercontent.com/python-visualization/folium/master/examples/data"
& U' |. j1 D# ~ )
" C; `7 ^' f. K, G! o# g us_states = f"{url}/us-states.json"
" O- f8 p& \5 X% s- [$ E
1 g/ ]- r9 L0 y2 v% d/ B geo_json_data = json.loads(requests.get(us_states).text). y; e! e& q" R/ B9 _' I
p' a$ u. v# P% E) r7 r' A- x7 X. M
- I7 Y; e: h( _' W- N6 X2 e
1 U) I# S' d4 u9 u$ M: Q0 |
+ b' B- J s6 c. b) ^) J, o# r" A
|